






John Cashin takes a very different approach from traders glued to five-minute charts. He starts with monthly charts, looks years or even decades into the past, and patiently waits for stocks to reach areas where long-term trends suggest an attractive opportunity.
Learn five great setups with huge potential upside
John Cashin
John Cashin is a full-time investor and trader who previously spent years running businesses as a plant manager. He now combines his understanding of businesses with long-term technical analysis to identify swing trades.
- Theta Daddies: John Cashin on YouTube

A swing trading strategy built around long-term trends
John starts his analysis zoomed far out, often using monthly charts. He looks for established ascending channels where a stock has repeatedly found support near the bottom and resistance near the top.
One particularly important level is what he calls the “bounce line”: an area that previously acted as resistance but later became support. A potential setup becomes especially interesting when that level converges with the bottom of a long-term channel.
He supplements these trend lines with exponential and simple moving averages and prefers companies he would be comfortable owning for an extended period.
So what does that look like in practice? John identifies five current setups.

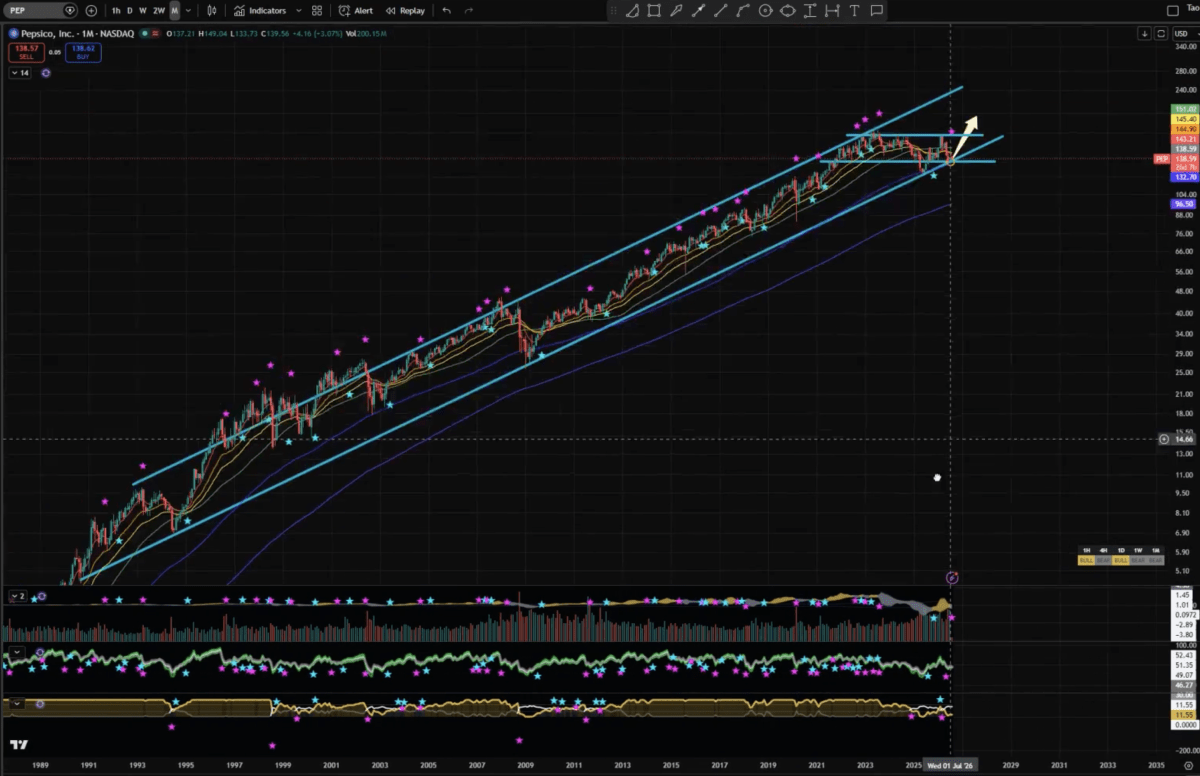
Setup #1: Pepsi (PEP) – Up to 70% potential upside
Pepsi is perhaps the clearest demonstration of John's long-term approach.
Its monthly chart shows an ascending channel stretching back to 1990. After more than three decades within that trend, Pepsi is again near its lower boundary and an important long-term support area.
John sees roughly 20–30% upside to previous all-time highs over perhaps six months. If Pepsi eventually travels toward the top of its long-term channel, he sees potential upside of upwards of 70%.
Because Pepsi has low volatility, Cashin favors LEAPS rather than shares to gain leverage. With the stock around $138 during the interview, he discusses buying a roughly one-year $130 call, slightly in the money.
Setup #2: Netflix (NFLX) – Waiting for confirmation
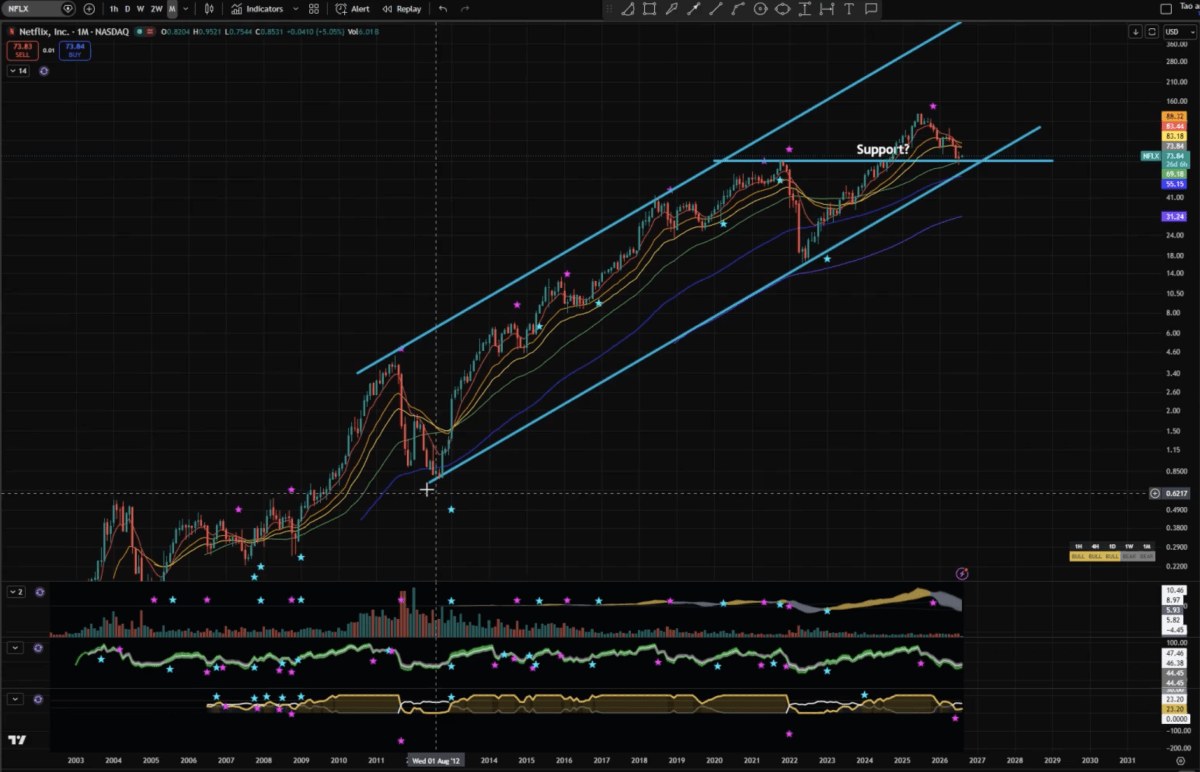
Netflix presents a different opportunity. The stock had fallen more than 50% from its highs before beginning to recover.
Zooming out, John sees a long-term channel stretching back to 2012. The stock is trading toward its lower end, close to a former resistance level that could now provide support.
But John isn't necessarily buying immediately. He wants to see whether Netflix holds around the $68 area and its monthly 50 SMA. A confirmed bounce could eventually offer around 85% upside back to previous highs.
Here he prefers shares and suggests that selling a roughly $70 cash-secured put could provide a potential entry while generating premium.
Setup #3: Costco (COST) – Higher risk, but substantial potential
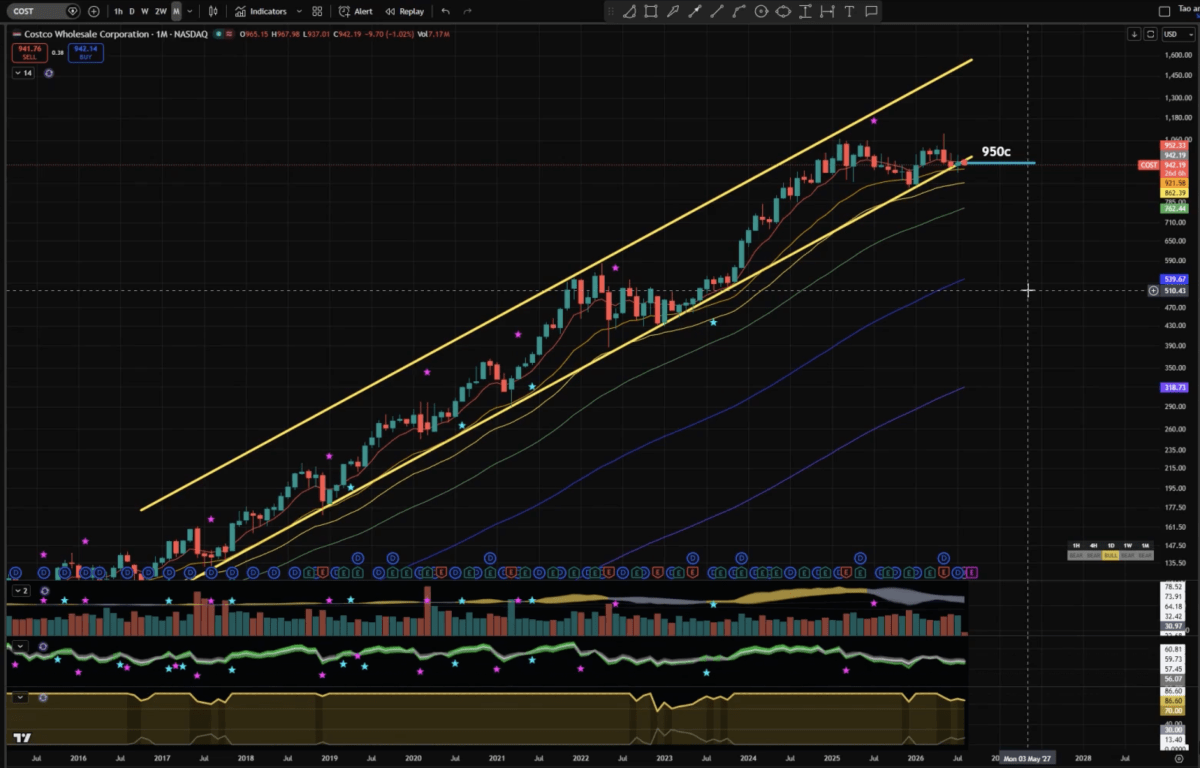
John is already trading his third setup: Costco.
Its monthly ascending channel dates back to 2016, with the lower trend line repeatedly providing support. However, John stresses that this is one of his higher-risk setups because the latest move had not yet confirmed whether Costco would hold the channel or break below it.
He entered using LEAPS and is looking toward approximately $1,000 as a target, although he believes $1,100 could be possible. He says reaching his planned target could produce approximately a 100% return on his particular options position.
That also illustrates why John likes LEAPS: a relatively modest move in the underlying stock can potentially create a much larger percentage return on the option.
Setup #4: Robinhood (HOOD) – Higher volatility and covered-call potential
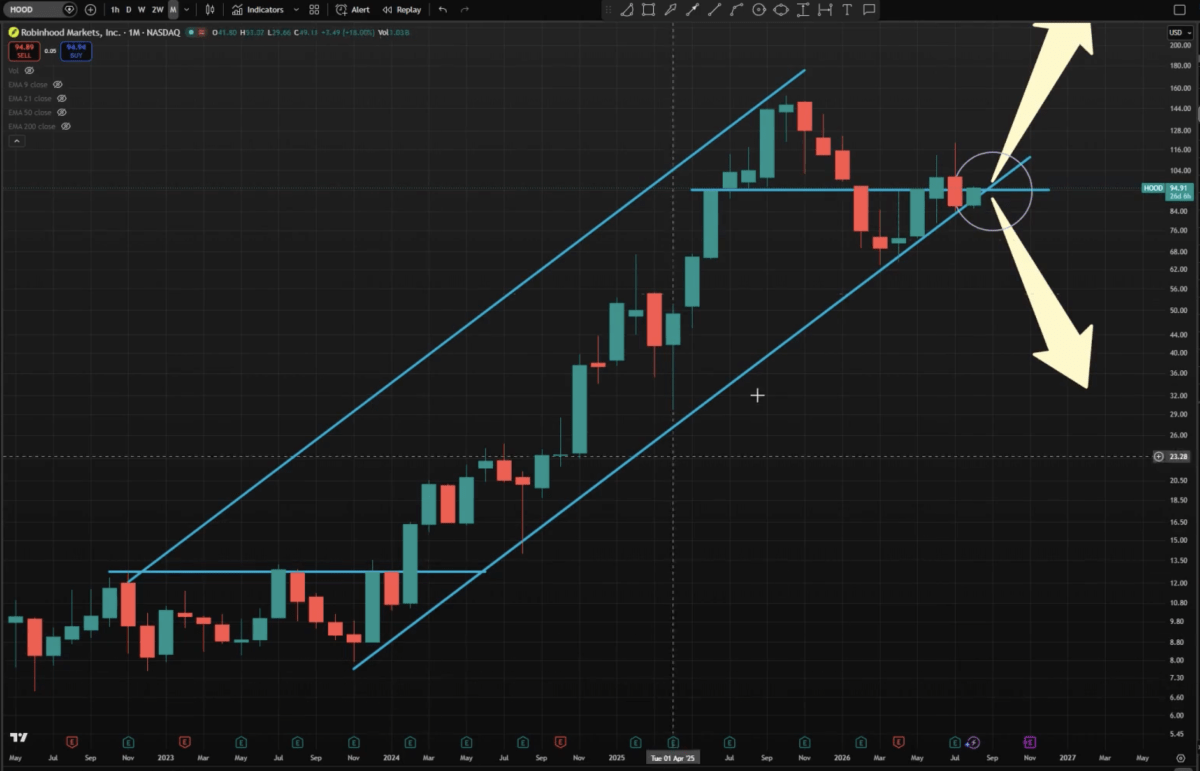
Robinhood is considerably more volatile.
John identifies channels on both its weekly and monthly charts. The stock had moved back above an important support area, and if that support holds, he sees the possibility of eventually returning to its previous high around $150, compared with approximately $95 at the time of recording.
Rather than LEAPS, John favors shares because Robinhood's higher volatility makes its options more expensive. That volatility also creates attractive premiums for covered calls.
Another possibility is selling approximately $90 cash-secured puts to seek a lower entry price, then potentially selling covered calls after assignment.
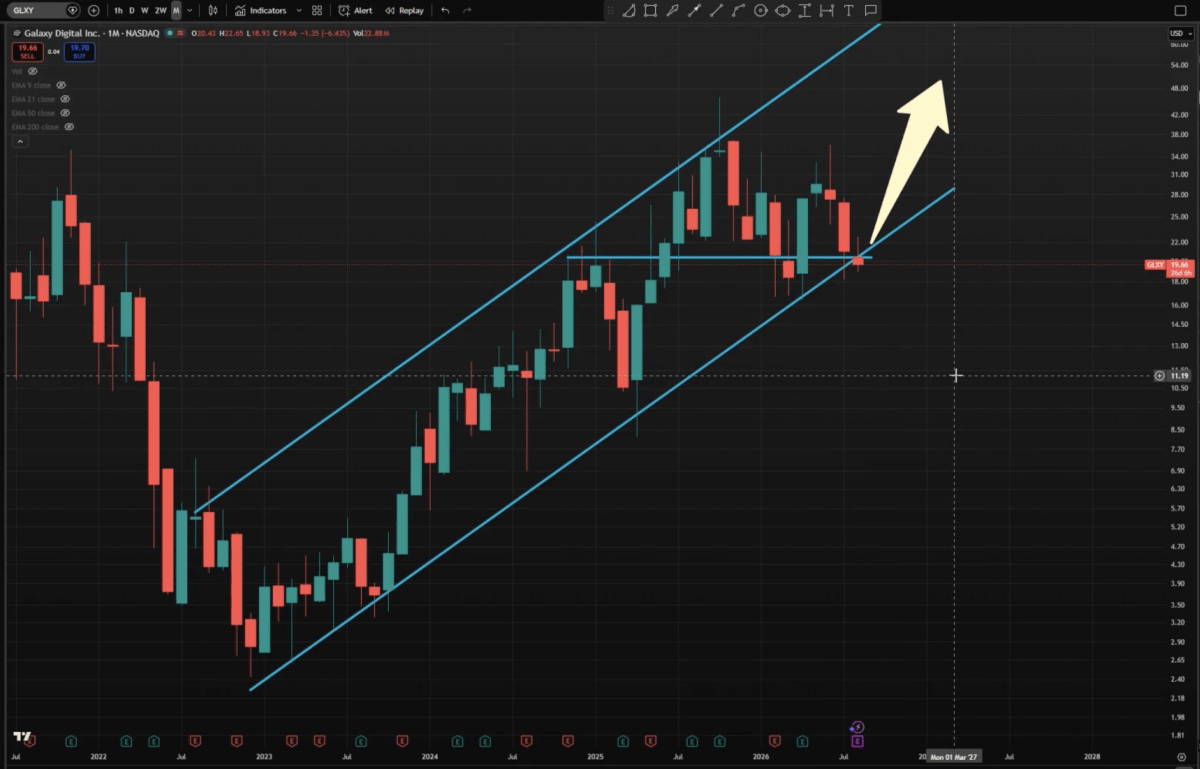
Setup #5: Galaxy (GLXY) – A speculative setup to watch
Galaxy is the most aggressive of the five examples.
The stock had just fallen roughly 12% following earnings and was trading below $20. Despite that sharp daily move, John's long-term chart showed a channel dating back to 2023, with its lower boundary providing support several times.
This is where his patience becomes important. Rather than reacting to the earnings drop, John wants to see whether Galaxy can reclaim the $20 area and remain within its channel.
If that happens, he believes it could potentially run back toward approximately $35, representing substantial upside from current levels. But if the long-term support breaks down, he says he wouldn't take the trade.
Shares, LEAPS and options as different tools
The five examples demonstrate that John's swing trading strategy isn't simply about finding a chart pattern.
He adjusts the instrument to the opportunity. Lower-volatility stocks may favor LEAPS. Companies he wants to own longer term can be bought as shares. Cash-secured puts can provide an income-generating entry method, while covered calls can generate income after acquiring shares.
Most importantly, he waits for confirmation rather than assuming every touch of long-term support will bounce.
John learned that lesson himself after entering Netflix too early and eventually taking roughly a 50% loss on a $5,000 position. He says he had broken his own rules by rushing the entry.

Strong results – with very little trading
John also shares results from two swing-trading accounts. His more aggressive account was up 105% year-to-date at the time of recording, while another account focused more on large established companies showed a 56% return over the previous year.
His central message is simple: zoom out, be patient and let the longer-term data guide the trade.
For options traders accustomed to making decisions measured in days—or even minutes – John's long-term swing trading strategy offers a radically different way to look for opportunities.
📚 Book recommended in this video
- Simon Ree: The Tao of Trading

