





- This article and video have been produced in cooperation with TanukiTrade, which is an affiliate partner of Theta Profits
A price chart may produce a promising swing-trade idea, but choosing the right options structure requires more information. In this interview, Gery Nagy explains how he uses TanukiTrade to bring options data into TradingView and evaluate a potential trade before opening the option chain.
Learn Gery's 5 steps before any trade
Gery Nagy
Gery Nagy is an experienced options trader and co-founder of TanukiTrade. He has traded options using a swing-trading approach since 2006.
- Check out our other interview with Gery: Most traders misunderstand gamma levels
Five questions before entering an options trade
After 20 years of experience in trading options, Gery today follows a five-step process before deciding to put on any trade. In the process, he asks five questions:
- What volatility regime is the market in?
- Are options relatively cheap or expensive?
- How much movement is already priced in?
- Which side and expiration carry the richer premium?
- What changes would make him manage, reduce, or exit the position?
TanukiTrade displays the relevant data directly on a TradingView chart, allowing Gery to evaluate the options environment alongside traditional price analysis.
TanukiTrade
…is an essential options trader toolkit offering seamless GEX levels, an options scanner and lots of useful data in a user-friendly interface. Works both as a web app and with TradingView.
Step 1: Start with the gamma environment
Gery begins by examining the gamma exposure, or GEX, associated with the expiration he may trade.
A key reference is the high volatility level, or HVL. This separates the positive and negative gamma zones. In a positive gamma environment, dealer hedging may work against price movements, potentially dampening volatility. In negative gamma, hedging can reinforce the move, potentially producing faster price changes and higher volatility.
The GEX profile also identifies the largest call and put concentrations, labelled C1 and P1 in TanukiTrade. Gery treats these as reaction zones—not automatic support, resistance, or trade signals. He watches the price action and momentum as the market approaches them.
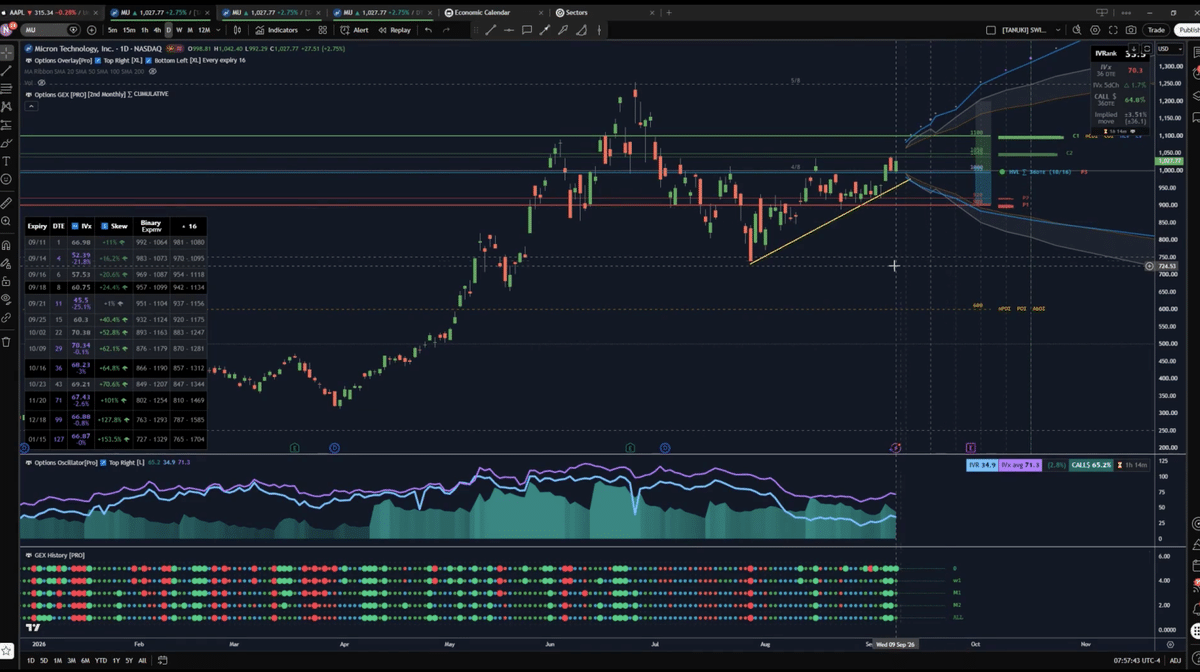
Because one GEX profile only provides a snapshot for a particular expiration, he also uses GEX history. This shows how the gamma regime is changing across several important expirations. For a swing trader, a broader shift from indecision to positive or negative gamma can be more informative than any single reading.
Step 2: Are options cheap or expensive?
The second step is to assess implied volatility.
TanukiTrade’s TradingView overlay displays IVX, IV Rank, and the five-day change in implied volatility. IVX represents the current implied volatility, while IV Rank places it within its range over the previous 52 weeks.
In the Micron example used during the interview, implied volatility was relatively low compared with its recent history but had started rising. That context helps Gery understand what he is paying when buying premium and the risk he is accepting when selling it.
He also compares implied volatility with the gamma regime. Selling premium in a negative gamma environment with rising volatility presents a different risk profile from selling it in positive gamma. The strategy therefore needs to fit both the volatility pricing and the likely behaviour of the underlying market.
Step 3: Use expected move to set realistic targets
Gery then examines how much movement the options market has priced in before the selected expiration.
TanukiTrade plots three probability ranges on the chart: a binary expected move derived from option prices, a theoretical one-standard-deviation range based on IVX and a delta curve that incorporates probability distance and skew.
These ranges help him judge whether a price target is realistic. When constructing a directional butterfly, for example, he generally wants the target strike to remain within the relevant probability range. An iron condor trader can use the same information when considering where to place short strikes.
The ranges do not predict where the stock will finish. They provide a market-derived framework for comparing the trade idea with current options pricing.
Step 4: Let skew help shape the trade
The fourth step is to examine vertical and horizontal skew.
Vertical skew compares call and put pricing within the same expiration. If calls are particularly expensive, Gery may investigate whether that pricing makes a call butterfly or broken-wing butterfly attractive. When SPX put skew and implied volatility are high, downside butterflies may offer an appealing reward-to-risk profile.
Horizontal skew compares implied volatility across expirations. This matters when trading calendars and diagonals. Gery looks for relationships where the short front expiration has higher implied volatility than the longer-dated option he buys.
The purpose is not to let skew dictate the trade. It helps determine which structure may express the original market idea most efficiently.
From market idea to options structure
In the interview, Gery works through a hypothetical bullish setup in Micron. He combines technical analysis with the GEX profile, probability ranges, volatility, and skew to identify a possible target and expiration.
He then compares structures such as a butterfly and a calendar spread. Delta is important because a directional trade intended to benefit from a fast move needs enough sensitivity to changes in the underlying price.
After entry, he continues monitoring the same information. If price breaks below the HVL and several expirations shift toward negative gamma, he may consider scaling out, hedging, rolling or closing. If the stock reaches the target and begins moving sideways, he may take partial profits and reassess the remaining position.
Step 5: Decide what would make you manage or exit
The fifth question is what changes would cause Gery to manage, reduce or exit the position. Rather than relying only on a fixed price or profit target, he watches whether the market environment has changed from the conditions that supported the original trade.
In his hypothetical bullish Micron butterfly, a move below the HVL would be important. If the GEX history also showed several key expirations shifting from positive to negative gamma, he would consider scaling out, adding a hedge, rolling or closing the position.
The same data can help when the trade moves in his favour. If Micron reaches the target and then trades sideways, Gery may take partial profits and watch the momentum before deciding what to do with the remainder. Because gamma levels can move during the life of a trade, he treats them as evolving reference points rather than fixed exit rules.
A more complete view inside TradingView
TanukiTrade adds GEX, implied volatility, expected move, probability ranges and skew to the familiar TradingView environment. The TradingView indicators refresh five times during the trading day, while TanukiTrade’s standalone web application can provide updates every minute.
Gery’s central lesson is straightforward: understand the environment, check the realistic range and pricing, and then monitor important changes throughout the trade. The chart may generate the original idea, but the options data helps determine how—and whether—to trade it.
