







- This article and video have been produced in cooperation with TanukiTrade, which is an affiliate partner of Theta Profits
Many retail traders see gamma levels, call walls, and put walls as direct buy and sell signals. But according to Chief Options Expert Gery Nagy at TanukiTrade, that is one of the biggest misconceptions in options trading.
How to use gamma levels in swing trading
Market structure
In this interview, Gery explains how he uses gamma levels as part of a broader four-layer market structure framework for swing trading SPX options.
Gery Nagy is Chief Options Expert at TanukiTrade and has traded options since 2006. He specializes in swing trading and market structure analysis using options positioning and volatility data.
Gamma levels are not predictions
One of the central themes in the interview is that gamma levels should not be viewed as prediction tools.
Instead, Gery describes them as “reaction zones” where market behavior may change due to dealer and market-maker hedging activity. A call wall does not automatically mean resistance, and a put wall does not guarantee support.
Gamma exposure, often called GEX, measures how options dealers may need to hedge as the market moves. Areas with high gamma concentration can therefore become important zones where volatility or momentum changes.
But according to Gery, traders should stop asking:
“What strategy should I trade?”
Instead, they should first ask:
“What kind of market environment am I trading in?”
That idea forms the foundation of his four-layer market structure analysis that he uses when planning his swing trades.
TanukiTrade
…is an essential options trader toolkit offering seamless GEX levels, an options scanner and lots of useful data in a user-friendly interface. Works both as a web app and with TradingView.
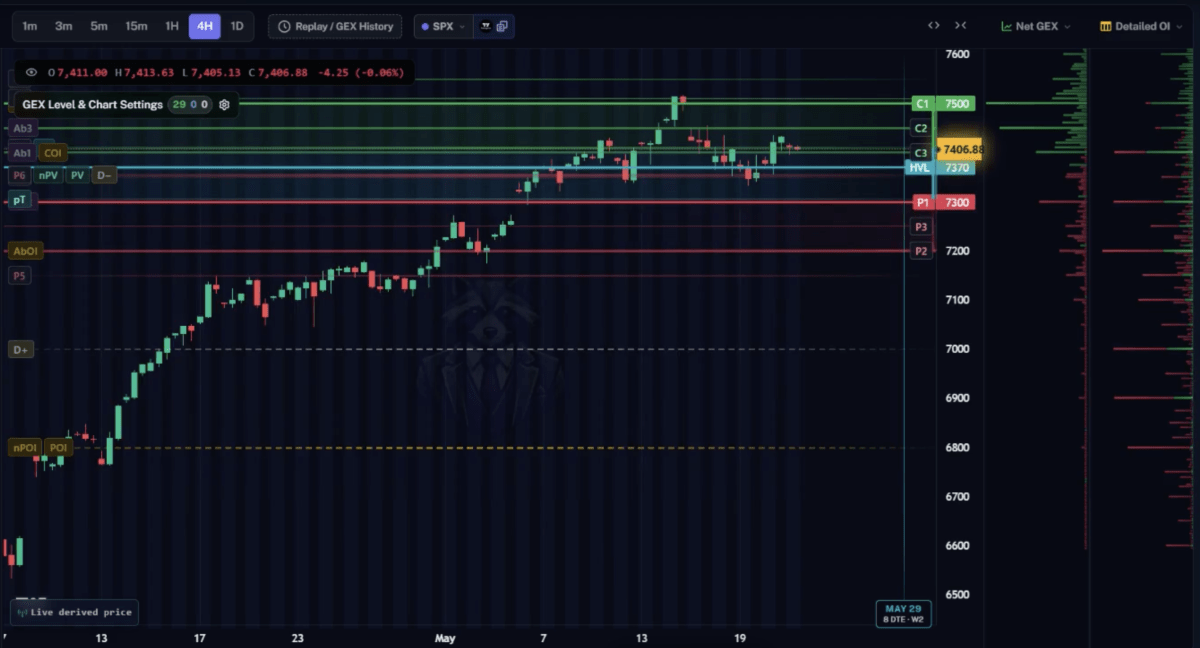
Layer 1: Identifying the volatility regime
The first layer focuses on identifying the current volatility regime.
Gery explains the difference between positive gamma and negative gamma environments. In a positive gamma regime, market makers hedge against price moves, which tends to reduce volatility and dampen market swings. In a negative gamma environment, dealers hedge with the move, which can increase volatility and accelerate price action.
Importantly, positive gamma does not automatically mean bullish, and negative gamma does not automatically mean bearish. Instead, these regimes describe the behavior of the market rather than its direction.
For swing traders, this can be extremely important when selecting options strategies. Premium-selling strategies such as iron condors or naked options trades may behave very differently depending on whether volatility is being dampened or amplified.
Gery uses the high volatility level (HVL) as a key pivot between positive and negative gamma territory.
Layer 2: Understanding key gamma levels
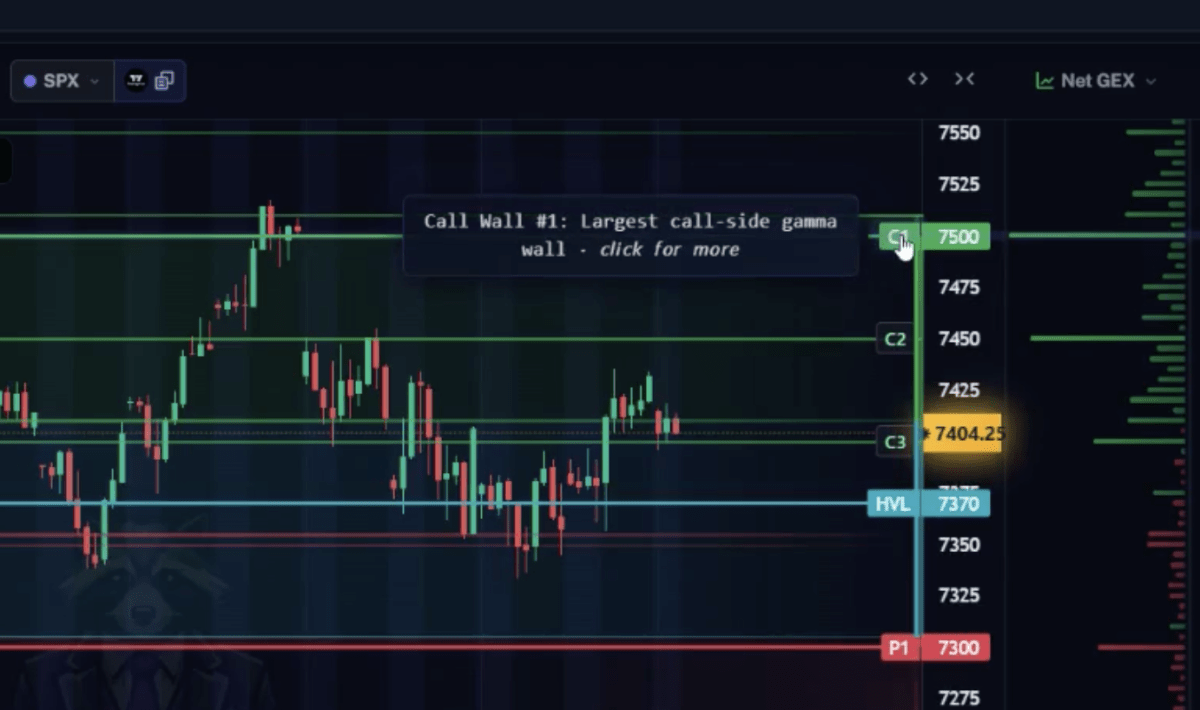
The second layer involves identifying key gamma levels such as call walls, put walls, and other major GEX concentrations.
Using SPX as an example, Nagy explains how traders can locate the highest concentration of call gamma and put gamma across different strikes and expirations.
These levels can become important reaction zones because of dealer hedging activity. But again, Gery stresses that traders should not blindly assume that the price will reverse at these levels.
Instead, the purpose is to identify areas where traders should pay close attention to momentum and price behavior.
For swing traders, these levels can help with:
- identifying possible target zones
- adjusting hedges
- scaling out of positions
- managing risk
Rather than using gamma levels as direct entry signals, Gery uses them as context during the life of a trade.
Layer 3: Analyzing open interest positioning
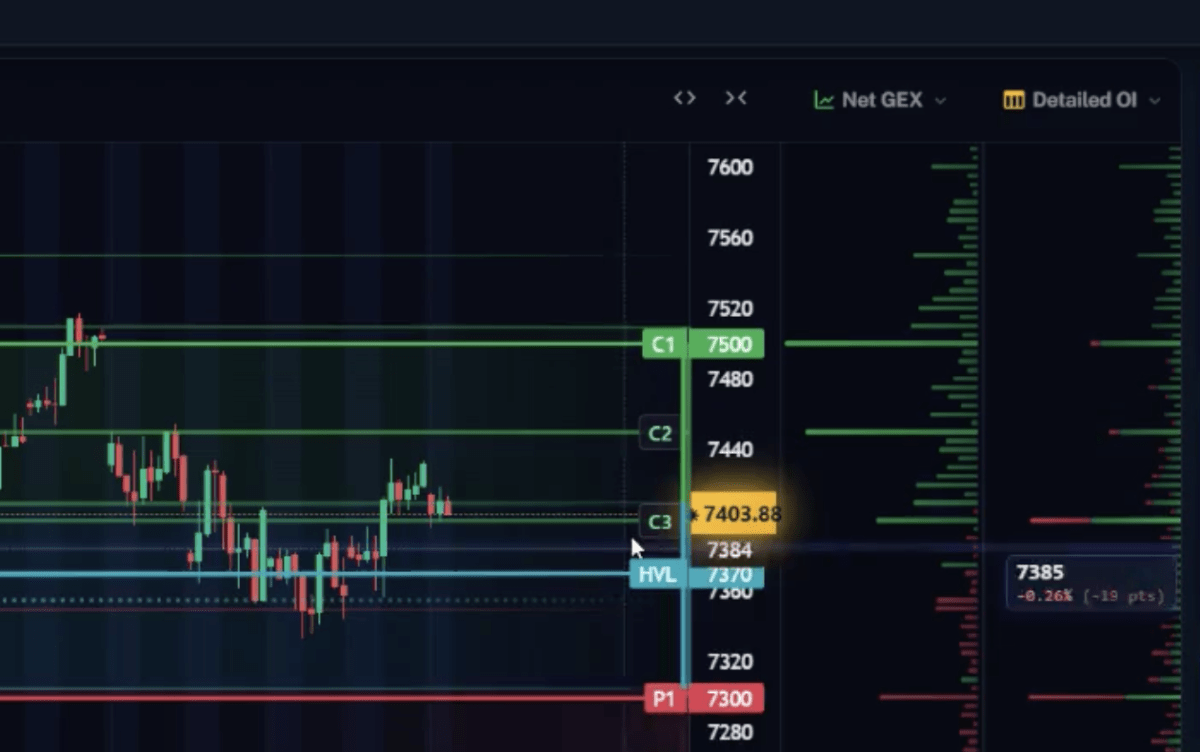
The third layer focuses on open interest and positioning distribution.
Gery explains that not all gamma levels are equally important. Traders should also study where call and put open interest is concentrated across the options chain.
By analyzing open interest distribution, traders can better understand how positioning is structured in the market. Large concentrations of call or put open interest can sometimes reveal where traders are heavily positioned or hedged.
He also looks for confluence between different metrics. When gamma levels, open interest, and other positioning data align at the same strike, market reactions may become more significant.
This layer helps traders understand whether market positioning is balanced or skewed heavily toward calls or puts.
Layer 4: Following the options flow and volume
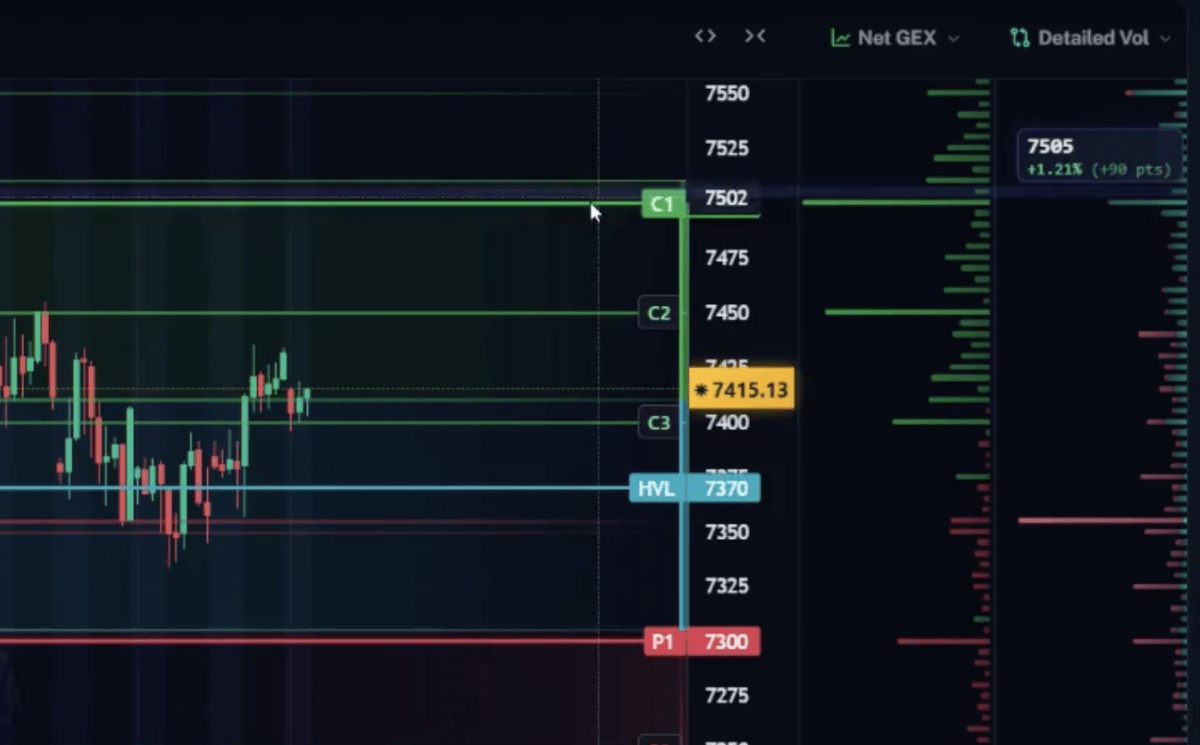
The fourth layer examines current market flow and options volume activity.
Here, Gery studies whether call volume or put volume is dominating and where unusual options activity appears across the chain.
For example, large out-of-the-money call or put volume can sometimes provide clues about speculative positioning or changing market sentiment.
Combined with the other three layers, options flow helps traders understand what is happening in the market right now rather than relying entirely on static positioning data.
Gery emphasizes that the market structure map can change quickly when the market moves sharply or when major news hits the tape. That is why traders must constantly monitor how positioning evolves over time.
The main takeaway for swing traders
Gery summarizes his approach with one simple principle:
“GEX has to be thought about as context and not as signal.”
That may be the most important takeaway from the interview.
Instead of treating gamma levels as magical prediction tools, traders should use them to better understand market structure, volatility conditions and dealer positioning.
For swing traders, combining volatility regimes, gamma levels, open interest, and options flow can create a much clearer picture of the current trading environment — and help improve risk management throughout the life of a trade.

[…] identify these levels, he uses market structure, gamma levels, options positioning, and tools that visualize gamma exposure and open […]
[…] Check out our other interview with Gery: Most traders misunderstand gamma levels […]