






- This article and video have been produced in cooperation with Option Omega. Theta Profits has an affiliate relationship with Option Omega, and may earn a commission if you sign up through our link.
Option Omega has launched what may be its biggest upgrade since the platform was introduced: a powerful new Optimizer that can run up to 500 options backtests simultaneously.
In this interview, Matt Simon demonstrates how the tool helps traders adapt when proven strategies stop working by finding more robust parameter combinations in minutes instead of hours.
Watch how the Optimizer fixed broken strategies
Why this launch matters
Backtesting has always been an essential part of systematic options trading. The problem is that testing different ideas has traditionally been slow.
Most traders change one parameter, run a backtest, review the results, adjust another setting and repeat the process. Testing hundreds of combinations quickly becomes impractical, making it difficult to know whether a strategy is genuinely robust or simply optimized for historical data.
The new Option Omega Optimizer changes that workflow completely.
Instead of evaluating one variation at a time, traders can now test up to 500 parameter combinations simultaneously, dramatically reducing the time required to optimize a strategy.
Option Omega
…is a platform for backtesting, automation and trade modelling. With Option Omega you can backtest your options strategy with data going back to 2013. Once you have identified your strategy, it can easily be automated. Option Omega also has a powerful tool to model your trades.
Get 50% OFF your first year with Option Omega with this affiliate link
Running hundreds of backtests simultaneously
The Optimizer is designed to search through large combinations of strategy settings automatically.
During the interview, Matt demonstrates examples involving hundreds of simultaneous tests, allowing traders to compare how different parameter values affect overall performance.
Rather than producing a single “best” result, the software creates visual dashboards showing which areas consistently perform well across a range of parameter values.
That gives traders a much broader understanding of how a strategy behaves instead of focusing on one isolated backtest.
Example 1: Finding the best entry time
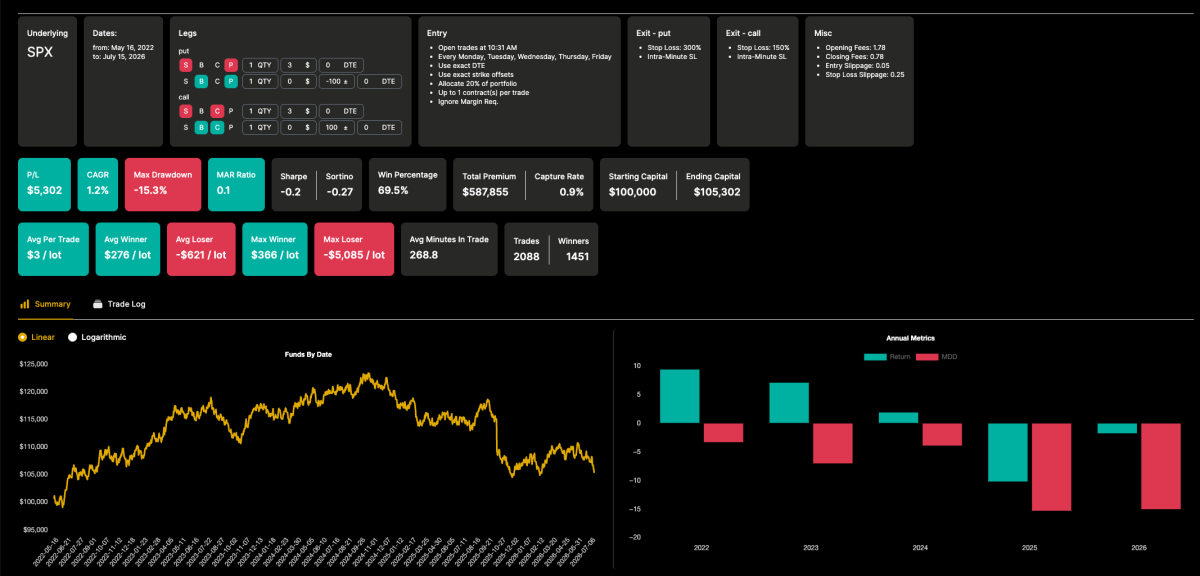
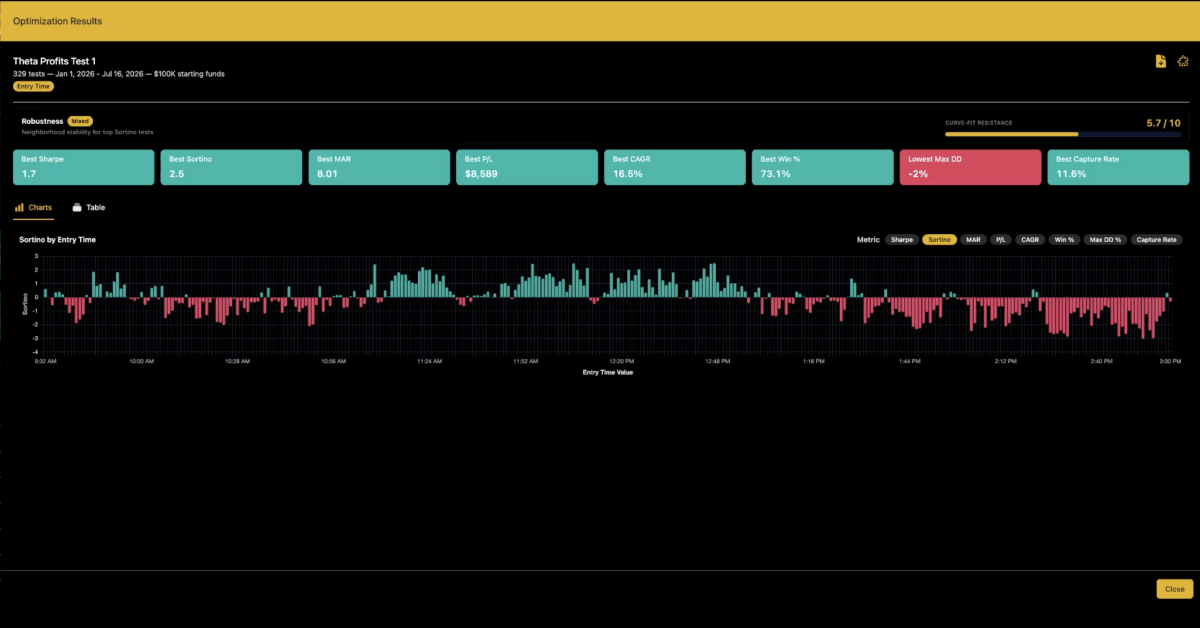
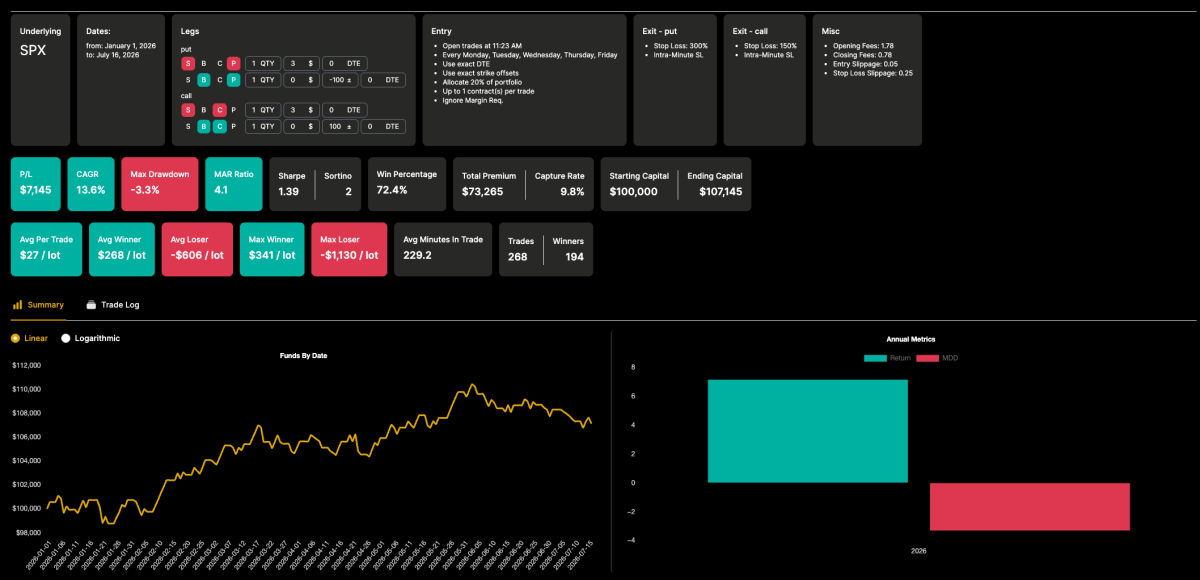
The first demonstration shows how the Optimizer can improve a strategy by testing a wide range of possible entry times. Instead of manually running each variation one after another, the software evaluates hundreds of combinations simultaneously and presents the results as heat maps and interactive charts.
Rather than simply highlighting the single best-performing entry time, Matt explains that traders should look for larger clusters of consistently strong results. These “sweet spots” indicate parameter ranges that are more likely to continue performing well, making the strategy more robust as market conditions evolve.
Example 2: Optimizing strike selection
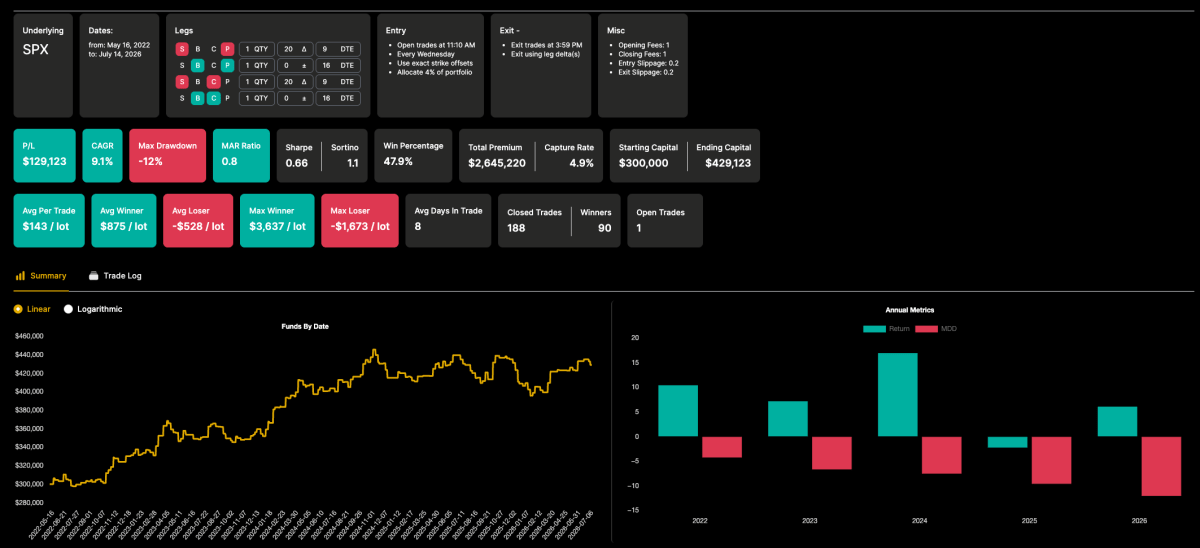
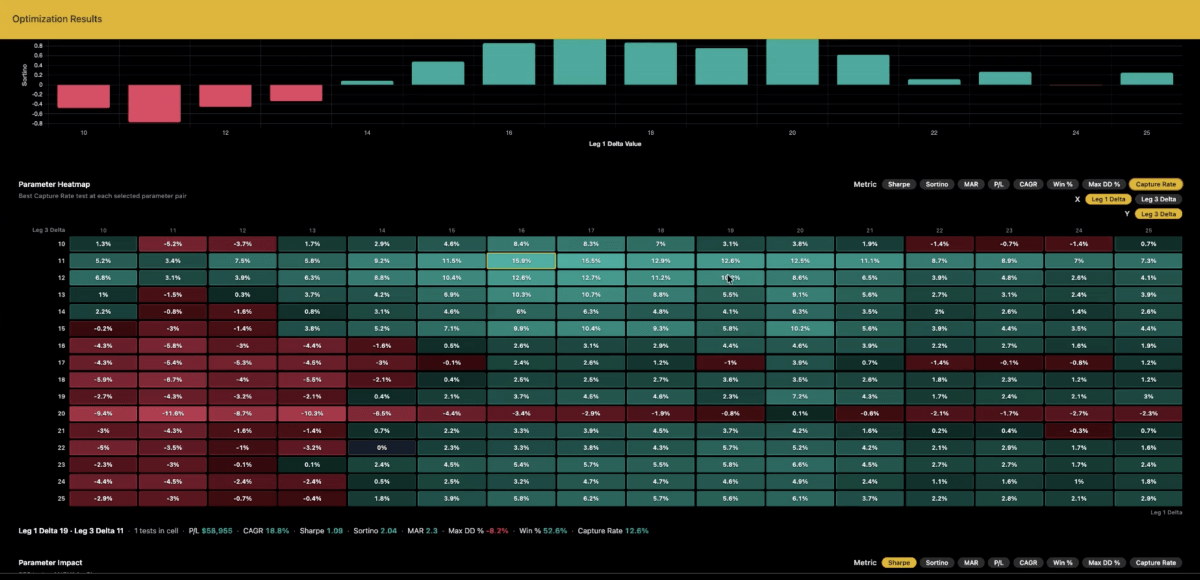
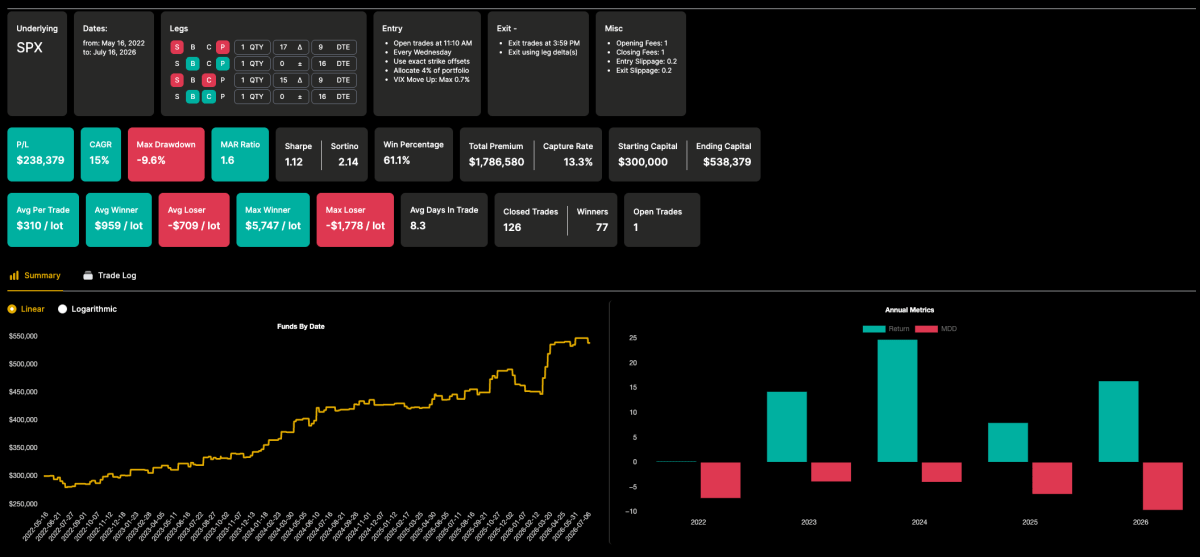
The second example focuses on option strike selection. Here, Matt demonstrates how the Optimizer tests hundreds of different strike combinations for a double calendar trade and visualizes the results using a color-coded heat map.
The visualization makes it easy to see how small changes in strike selection affect important performance metrics such as Capture Rate and Sortino Ratio. Instead of chasing one exceptional historical result, traders can identify broader regions where many neighboring strike combinations perform well. According to Matt, this leads to strategies that are more robust and less dependent on a narrowly optimized set of parameters.
Finding robust strategies instead of perfect backtests
One of the central themes of the interview is the difference between optimization and curve fitting.
Matt explains that the goal is not to discover the one parameter combination that produced the highest historical return. Those results may simply be statistical luck.
Instead, traders should look for robustness – parameter ranges where many neighboring combinations produce consistently strong results.
The Optimizer makes this much easier by displaying heat maps and performance charts that highlight these “sweet spots.” When a larger cluster performs well, traders can have greater confidence that the strategy is built on a genuine market edge instead of historical coincidence.
To support this process, the software also introduces a Robustness Score, which measures how stable high-performing parameter regions are instead of rewarding only the single best backtest.

Evaluating strategies from different perspectives
Another strength of the Optimizer is the flexibility it gives traders when comparing results.
Rather than ranking strategies solely by profit, users can optimize using several different performance metrics, including:
- Sharpe Ratio
- Sortino Ratio
- MAR Ratio
- Profit and Loss
- CAGR
- Win Rate
- Maximum Drawdown
- Capture Rate
This allows traders to optimize according to their own objectives. Some may prioritize maximum returns, while others prefer smoother equity curves, lower drawdowns or stronger risk-adjusted performance.
Matt also points out that different optimization goals can produce different “best” parameter combinations. Looking at several performance measures helps traders choose settings that fit their own risk tolerance rather than blindly pursuing the highest return.
A smarter way to adapt
One of Matt’s most important messages is that traders don’t necessarily need to abandon strategies when performance deteriorates.
Markets change, and strategies often need to evolve with them.
Instead of starting over, the Optimizer makes it possible to revisit proven strategies, test hundreds of alternative parameter combinations, and quickly identify settings that are better suited to current market conditions.
That makes the research process dramatically faster while reducing the temptation to rely on curve-fitted results.
