





A bullish chart can be tempting. But before committing money, Imran wants to know whether the options market supports the opportunity. In this Theta Profits interview, he explains how his Delta framework helps him decide whether to follow a move, anticipate a reversal, or stay out.
Learn about Imran’s Delta framework
Imran Lakha
Imran spent more than 20 years trading options at investment banks, including Merrill Lynch, Bank of America, and Citibank. Based in London, he now runs Options Insight, an options education business.
🧰 Recommended tools for options traders
These are affiliate links. Theta Profits may earn a commission if you sign up through them. I have tried all the products myself and believe they add real value for options traders.
🎯 EDGESEEKER — Quant analysis for options traders. Edge first. Then trade. Try free for two weeks, then save €20 monthly or €220 on the annual plan.
🟣 TANUKITRADE — Gamma levels and options data, available as a web app or on TradingView. Get 10% off through this link.
📉 EARNINGS WATCHER — Research and analyze options trades around earnings releases. Save 33% on the annual plan.
🗓️ OPTION OMEGA — Backtest options strategies and automate your trades. Get 50% off your first year.
📊 MENTHORQ — AI-powered market intelligence and trading insights. Get 20% off with code MQ20.
🛠️ OPTIONSTRAT — Plan, analyze and visualize your options trades. Get 20% off your first month.
🚀 OPTION SAMURAI — Scan the market to find options opportunities that fit your trading strategy. Free 2-week trial.
Why directional options trading needs more than a chart
Imran still considers technical analysis and fundamentals important. His argument is that many traders already study them, so he looks for additional evidence in options pricing and positioning.
Large options positions can influence how dealers hedge, potentially amplifying a market move or helping restrain it. Changes in option prices can also offer clues about demand for upside exposure or downside protection.
His delta framework brings those observations together. It is a discretionary decision process, with no claim that predicting direction becomes easy.
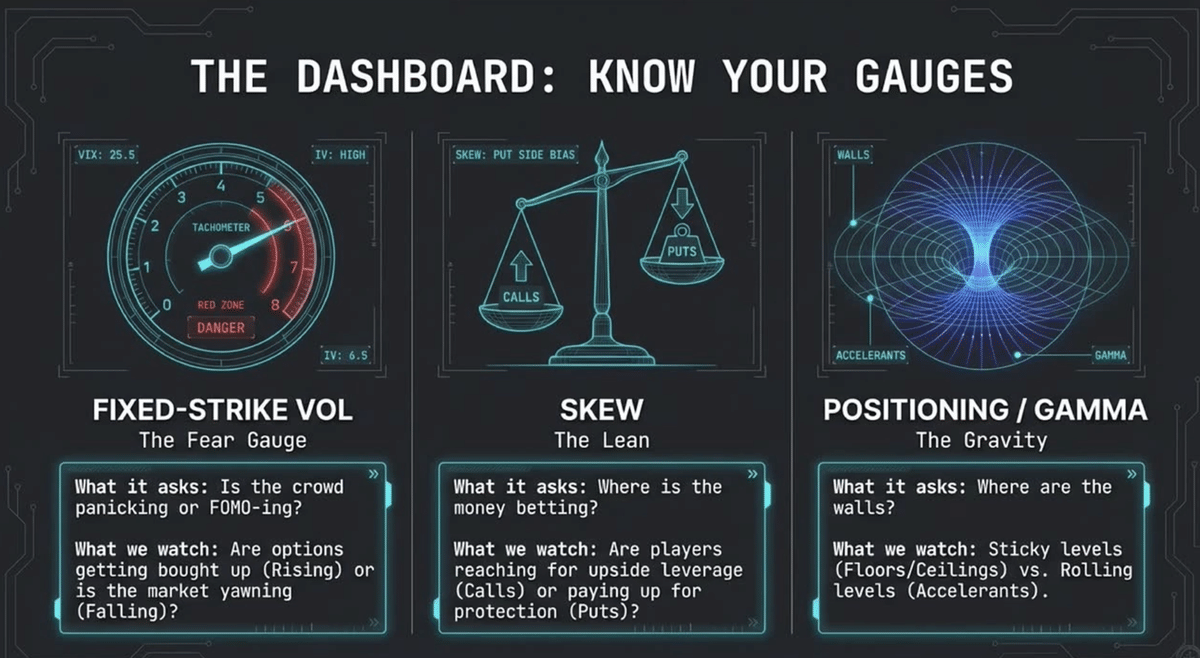
Check 1: Fixed-strike volatility
Fixed-strike volatility tracks changes in implied volatility at a particular strike. Imran uses it to assess whether options are attracting buyers or sellers as the underlying moves.
For example, rising volatility during a rally towards resistance can support his breakout thesis. He interprets it as a possible sign that dealers are short options and becoming uncomfortable, with hedging flows potentially adding fuel to the move.
Conversely, a decline in the underlying without rising volatility can suggest less stress than the price chart alone implies. These are clues he weighs alongside the other checks.
Check 2: Skew
Skew describes differences in implied volatility across strikes. Imran focuses on the relative pricing of out-of-the-money calls and puts.
If an asset keeps falling while pricing shifts towards calls, he sees a potential divergence: options traders may be positioning differently from what the recent decline suggests.
Extremely expensive puts can also indicate panic. He watches for signs that demand for protection is becoming exhausted, potentially creating conditions for a bounce. An extreme reading is part of his assessment, rather than an automatic entry signal.
Check 3: Options positioning
Imran also tracks where open interest is concentrated and how those concentrations change.
If price reaches a large concentration of calls and that concentration shifts higher, he interprets it as consistent with traders rolling their upside exposure. That can strengthen his view that the move has further to run.
If the concentration stays fixed, he becomes more alert to resistance or a reversal. The distinction matters: he is interpreting positioning data, not directly observing every participant’s intentions.
Four setups for different conditions
Imran combines his three checks with the price chart to identify four recurring setups. Each represents a different opportunity, from joining a breakout to catching a temporary bounce, and influences both his choice of options structure and how quickly he plans to exit.
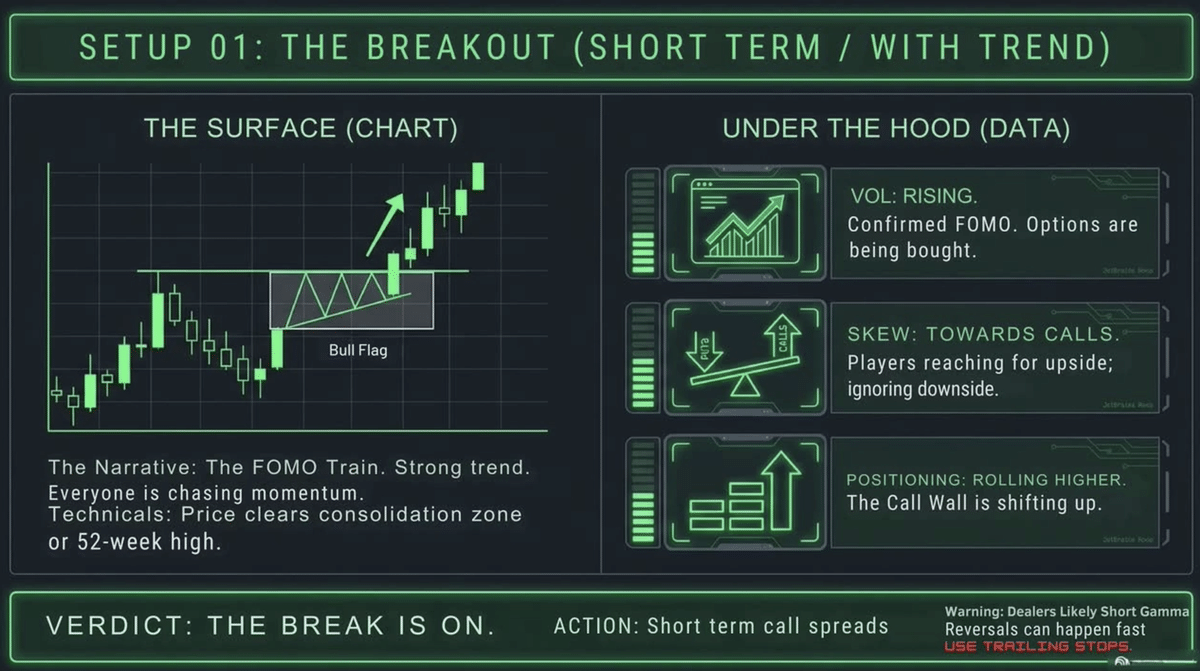
Breakout: following a move through resistance
This setup looks for an existing uptrend to accelerate as price breaks through resistance. Imran wants rising fixed-strike volatility, skew shifting towards calls and call positioning moving to higher strikes. He may use a short-term call spread to participate without paying for an outright call at elevated implied volatility.
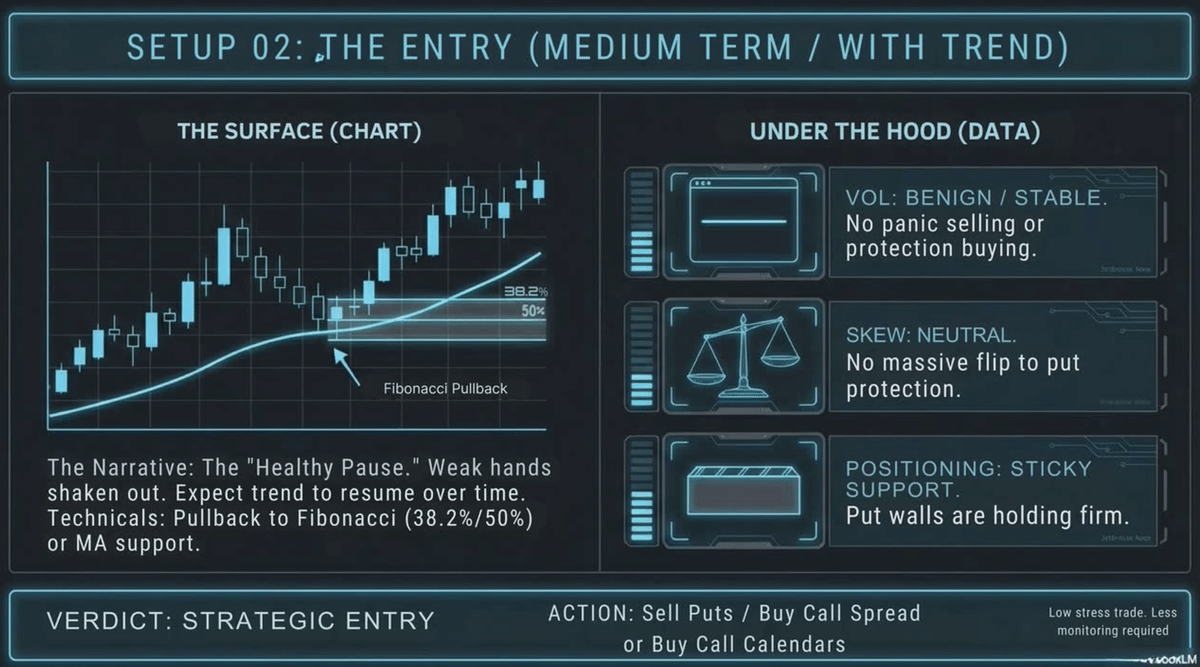
Entry: buying a pullback within an uptrend
Here, Imran looks for an opportunity to join an established uptrend after a correction towards support. He wants volatility to remain stable or decline, no aggressive shift towards puts, and put support levels to hold. His GDX call spreads illustrate this approach, with a longer expiration giving the anticipated recovery time to develop.
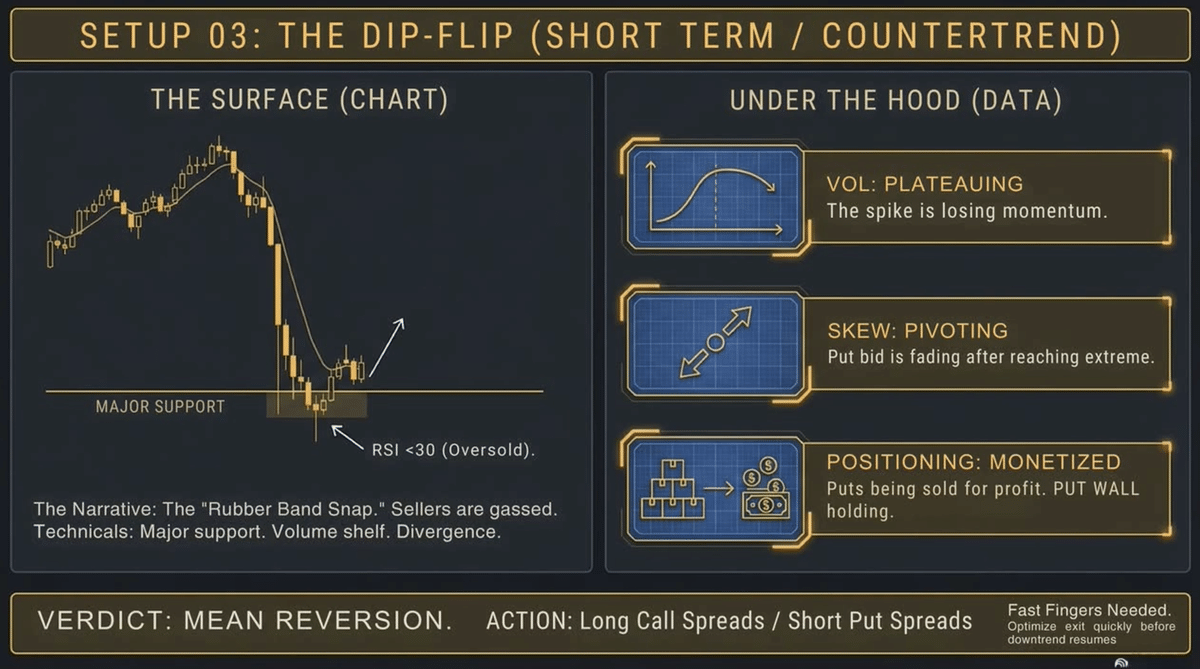
Dip-Flip: catching a short-term relief bounce
The Dip-Flip targets a bounce after an aggressive selloff, without assuming the broader downtrend has ended. Imran looks for a volatility spike to stabilise, extreme put demand to ease and put holders to start taking profits. He considers structures such as short-dated put credit spreads or call debit spreads, aiming to exit quickly if the bounce arrives.
Pullback: spotting an exhausted rally
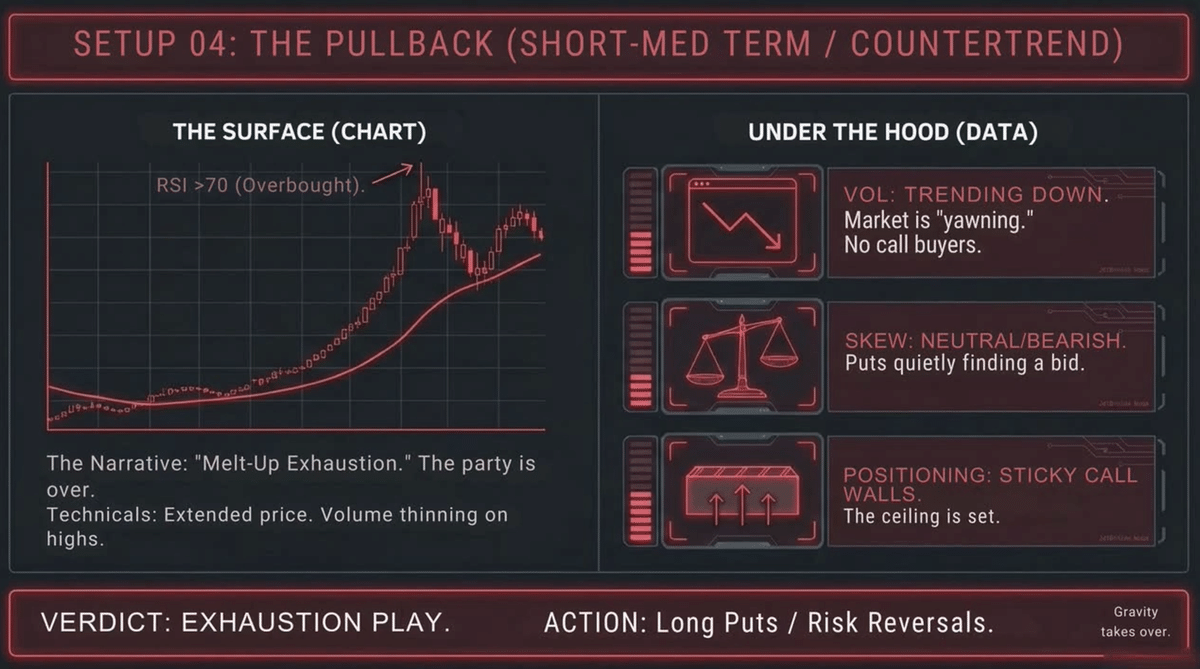
This setup looks for a reversal when price appears overextended but the options market does not support further upside. Imran watches for flat or falling volatility, skew favouring puts and call concentrations that remain fixed rather than shifting higher. Together, those observations can strengthen his suspicion that the rally is running out of momentum.Each setup calls for a different combination of evidence, time horizon and trade structure.
GDX: Turning a view into an options trade
The practical example is GDX, the gold miners ETF. At recording, it had pulled back after a strong rally.
Imran saw several reasons to consider a bullish entry: implied volatility had fallen during the decline, skew favoured calls, and put support levels were holding. Together, those observations supported his interpretation of a pullback within an uptrend.
He explained that he had bought March 2027 call debit spreads, giving the thesis time to develop. A call debit spread pairs a purchased call with a sold call at a higher strike, limiting both potential profit and loss.
His choice reflects an important distinction: identifying direction and choosing the trade are separate decisions. He considers timing, volatility pricing, potential reward and how much premium he is willing to risk.
Plan the exit before emotions take over
Imran generally sizes directional debit trades so he can accept losing the premium. However, that does not mean holding every losing position until expiration.
If the thesis weakens, he may recover remaining value and redeploy it elsewhere. He also considers taking profits or rolling before a spread reaches its maximum payout.
He highlights premium decay as a central risk. Repeatedly buying options while anticipated moves fail to develop can steadily damage a portfolio.
At recording, he reported roughly 25% from his directional-trade category, measured against a $25,000 account basis. He was taking fewer, more selectively chosen trades, but acknowledged that one year cannot establish whether the improvement came from his framework or luck.
His central message is practical: use additional evidence to choose opportunities carefully, then select a structure and risk level that fit the view.
